Google\u2019s revenue from advertising has been rising steadily since 2001, reaching $95.38 billion in 2017.<\/p>\n\n\n\n
With more and more advertisers moving away from print media and into digital, these trends look set to continue. A 2017 study conducted by advertising consultancy WARC<\/a> found that globally 18% of all ad spending goes to Google, with that figure rising to 25% when taking into account ad revenue generated by Facebook as well.<\/p>\n","post_title":"Digital vs. Print Advertising (Infographic)","post_excerpt":"","post_status":"publish","comment_status":"open","ping_status":"closed","post_password":"","post_name":"digital-vs-print-advertising-infographic","to_ping":"","pinged":"","post_modified":"2019-12-27 20:45:15","post_modified_gmt":"2019-12-28 04:45:15","post_content_filtered":"","post_parent":0,"guid":"https:\/\/siliconvalley.center\/blog\/digital-vs-print-advertising-infographic\/","menu_order":0,"post_type":"post","post_mime_type":"","comment_count":"0","filter":"raw"}],"next":false,"prev":false,"total_page":1},"paged":1,"column_class":"jeg_col_2o3","class":"epic_block_5"};
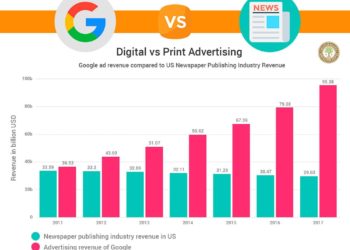
Revenue generated by the newspaper publishing industry in the United States has been dropping steadily in recent years, falling from $33.59 billion in 2011 to a forecasted $27 billion by 2020. Online publishing, meanwhile, has become an ever more prevalent force, with web platforms taking more and more advertising dollars away from traditional media.<\/p>\n\n\n\n
Google\u2019s revenue from advertising has been rising steadily since 2001, reaching $95.38 billion in 2017.<\/p>\n\n\n\n
With more and more advertisers moving away from print media and into digital, these trends look set to continue. A 2017 study conducted by advertising consultancy WARC<\/a> found that globally 18% of all ad spending goes to Google, with that figure rising to 25% when taking into account ad revenue generated by Facebook as well.<\/p>\n","post_title":"Digital vs. Print Advertising (Infographic)","post_excerpt":"","post_status":"publish","comment_status":"open","ping_status":"closed","post_password":"","post_name":"digital-vs-print-advertising-infographic","to_ping":"","pinged":"","post_modified":"2019-12-27 20:45:15","post_modified_gmt":"2019-12-28 04:45:15","post_content_filtered":"","post_parent":0,"guid":"https:\/\/siliconvalley.center\/blog\/digital-vs-print-advertising-infographic\/","menu_order":0,"post_type":"post","post_mime_type":"","comment_count":"0","filter":"raw"}],"next":false,"prev":false,"total_page":1},"paged":1,"column_class":"jeg_col_2o3","class":"epic_block_5"};
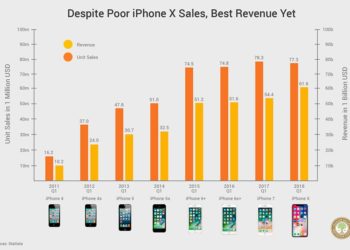
\n Have you noticed the shift? Apple understands luxury B2C retail better than any other tech giant. And, apparently, selling $1,000+ phone is a not a bad way to make money. Apple's pricing strategy is either a clever way to bolster revenue despite underperforming unit sales or a sign of product maturity and innovation stagnation. Only time will tell whether this approach pays off in the long run.<\/p>\n","post_title":"Apple iPhone X Sales and Revenue (Infographic)","post_excerpt":"","post_status":"publish","comment_status":"open","ping_status":"closed","post_password":"","post_name":"apple-iphone-x-sales-and-revenue-infographic","to_ping":"","pinged":"","post_modified":"2019-12-27 20:45:15","post_modified_gmt":"2019-12-28 04:45:15","post_content_filtered":"","post_parent":0,"guid":"https:\/\/siliconvalley.center\/blog\/apple-iphone-x-sales-and-revenue-infographic\/","menu_order":0,"post_type":"post","post_mime_type":"","comment_count":"0","filter":"raw"},{"ID":794,"post_author":"1","post_date":"2018-03-09 21:39:00","post_date_gmt":"2018-03-10 05:39:00","post_content":"\n Revenue generated by the newspaper publishing industry in the United States has been dropping steadily in recent years, falling from $33.59 billion in 2011 to a forecasted $27 billion by 2020. Online publishing, meanwhile, has become an ever more prevalent force, with web platforms taking more and more advertising dollars away from traditional media.<\/p>\n\n\n\n Google\u2019s revenue from advertising has been rising steadily since 2001, reaching $95.38 billion in 2017.<\/p>\n\n\n\n With more and more advertisers moving away from print media and into digital, these trends look set to continue. A 2017 study conducted by advertising consultancy WARC<\/a> found that globally 18% of all ad spending goes to Google, with that figure rising to 25% when taking into account ad revenue generated by Facebook as well.<\/p>\n","post_title":"Digital vs. Print Advertising (Infographic)","post_excerpt":"","post_status":"publish","comment_status":"open","ping_status":"closed","post_password":"","post_name":"digital-vs-print-advertising-infographic","to_ping":"","pinged":"","post_modified":"2019-12-27 20:45:15","post_modified_gmt":"2019-12-28 04:45:15","post_content_filtered":"","post_parent":0,"guid":"https:\/\/siliconvalley.center\/blog\/digital-vs-print-advertising-infographic\/","menu_order":0,"post_type":"post","post_mime_type":"","comment_count":"0","filter":"raw"}],"next":false,"prev":false,"total_page":1},"paged":1,"column_class":"jeg_col_2o3","class":"epic_block_5"};
Have you noticed the shift? Apple understands luxury B2C retail better than any other tech giant. And, apparently, selling $1,000+... Revenue generated by the newspaper publishing industry in the United States has been dropping steadily in recent years, falling from...
Apple iPhone X Sales and Revenue (Infographic)
Digital vs. Print Advertising (Infographic)